---
title: "Google Search Console weekly and monthly views: read the trend"
description: "Switch Search Console to weekly or monthly views. Follow a real chart comparison and check axis scales and incomplete periods before reporting a traffic change."
canonical_url: "https://gscdump.com/learn-google-search-console/weekly-monthly-views"
last_updated: "2026-09-11"
---
To see a weekly trend in Google Search Console, open your **Search results** Performance report and change **Daily** to **Weekly** above the chart. Start with a three-month date range so you have several weeks to compare. Google's [granularity selector](https://developers.google.com/search/blog/2025/12/weekly-monthly-views-search-console) also offers **Monthly**.
## Switch from daily to weekly
Choose **3 months** in the date filter. If you're using **24 hours**, change that first: Google [doesn't offer weekly or monthly granularity in that view](https://support.google.com/webmasters/answer/7576553?hl=en).
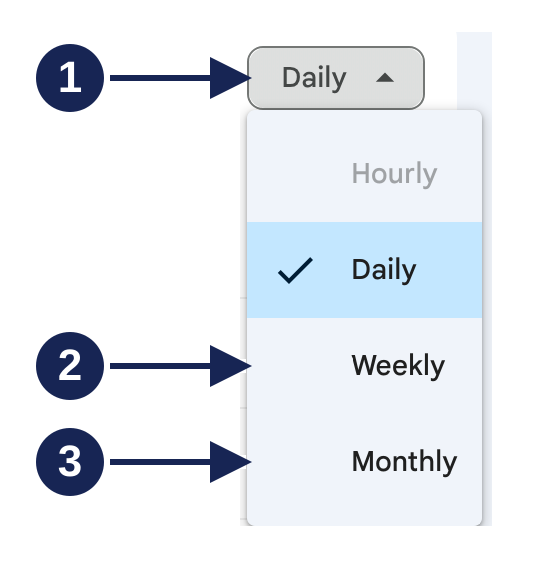
Menu captured on 11 September 2026. Numbered arrows identify the dropdown and its choices. Open the menu at full size.
The numbers identify the menu and its choices:
1. Open the **Daily** dropdown above the chart.
2. Choose **Weekly** to group the chart by week.
3. Choose **Monthly** instead when you want calendar-month groups. This is an alternative to step 2.
These controls also appear in the Google News and Discover Performance reports, according to [Google's announcement](https://developers.google.com/search/blog/2025/12/weekly-monthly-views-search-console).
## Read the same report in two views
These captures use the same site, three-month range, **Web** search type, and selected metrics. Only the granularity changes.
### 1. Daily: find individual spikes
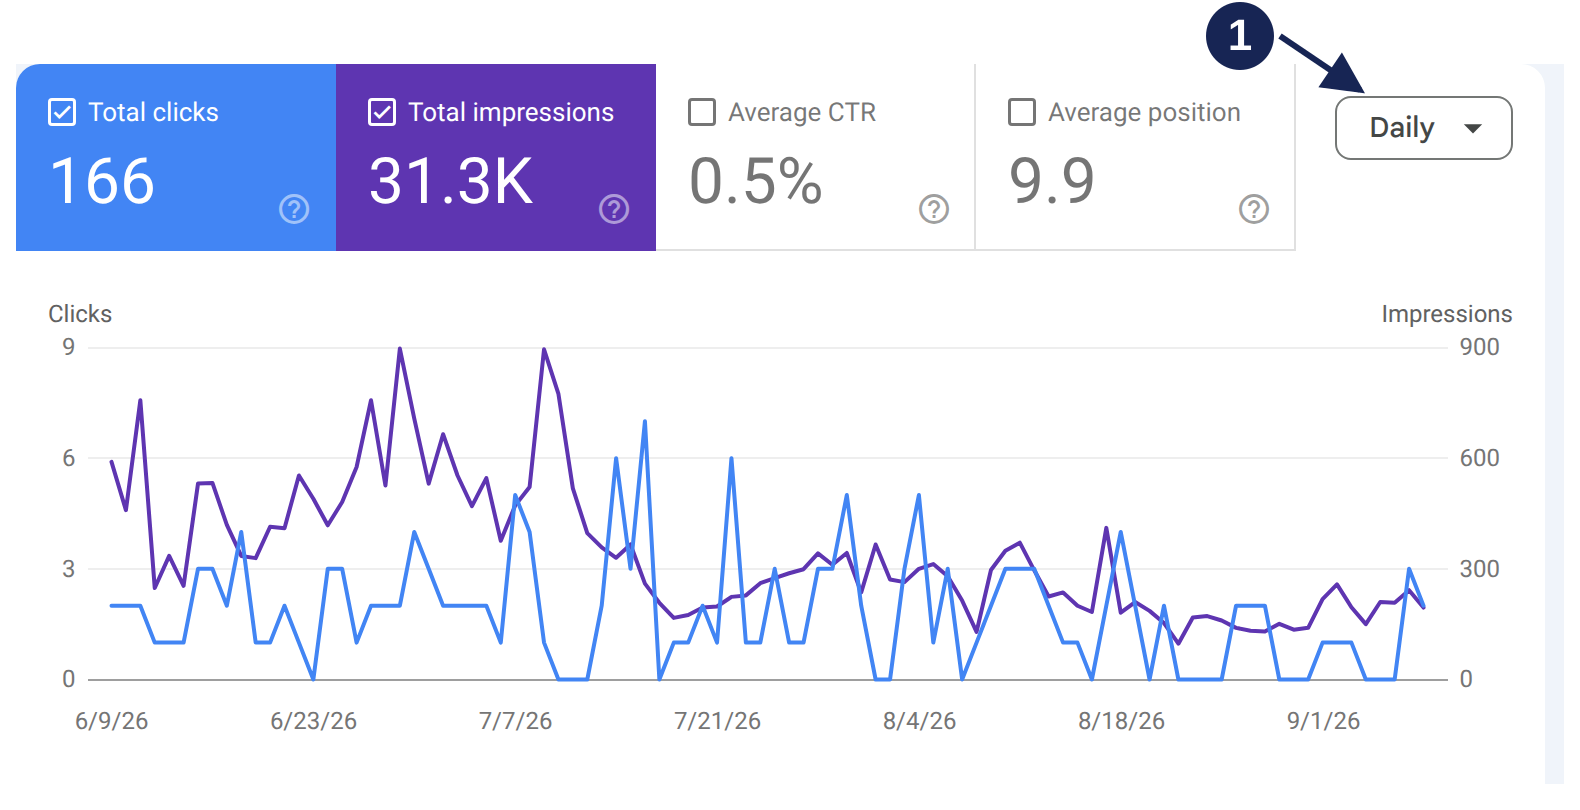
Daily view captured on 11 September 2026. Marker 1 identifies Daily. Open the daily chart at full size.
Marker **1** identifies the Daily setting. The clicks line uses the left axis, which reaches **9**. Impressions use the right axis, which reaches **900**.
In this capture, the daily impressions line has two sharp peaks around late June and early July. Daily detail helps you choose a date to investigate.
### 2. Weekly: follow the broader direction
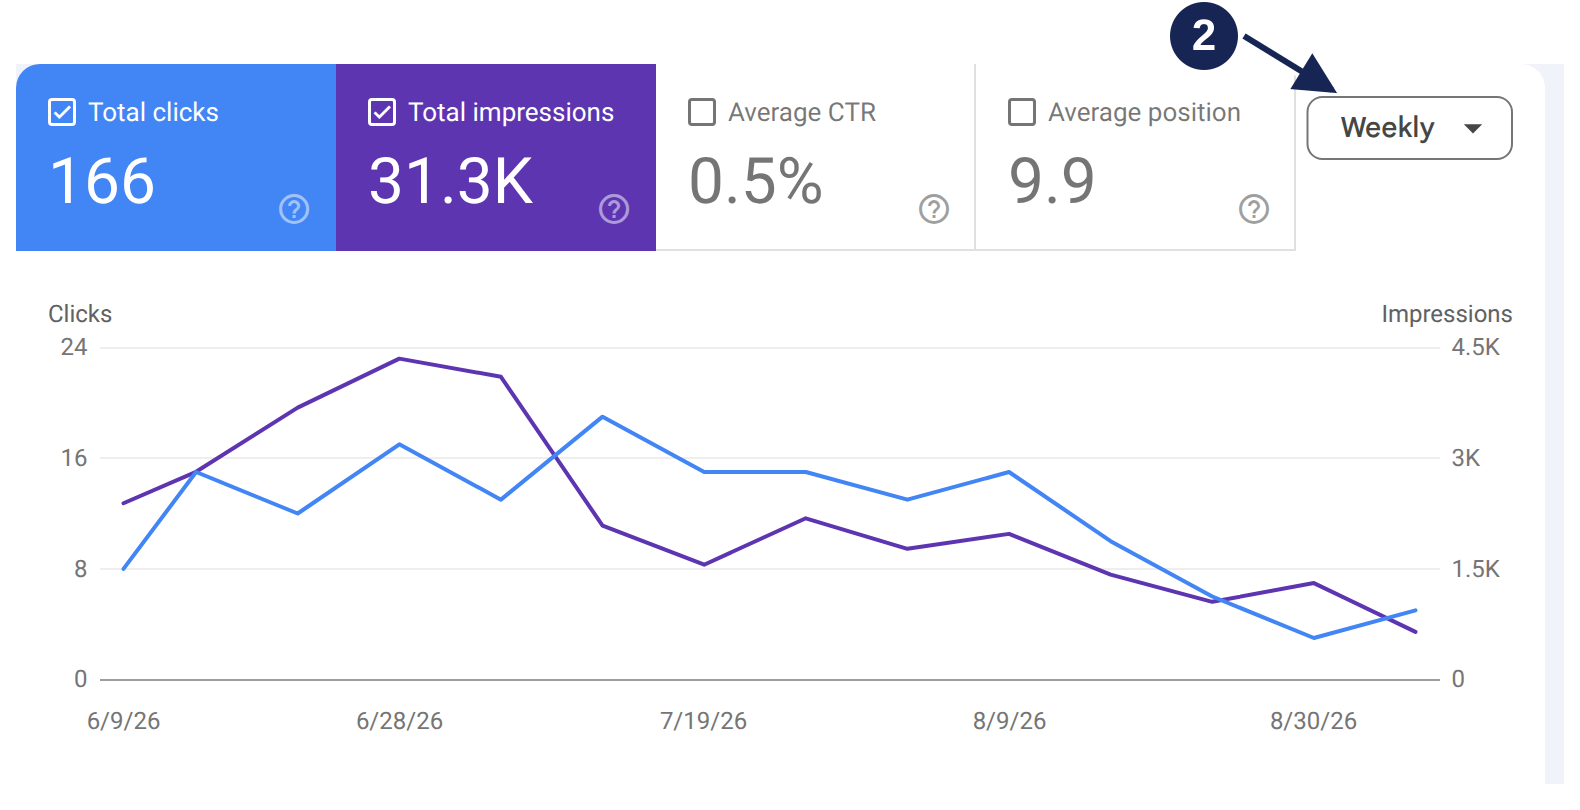
Weekly view captured on 11 September 2026, using the same report settings. Marker 2 identifies Weekly. Open the weekly chart at full size.
Marker **2** identifies Weekly. The totals haven't changed: **166 clicks**, **31.3K impressions**. The impressions line now shows a broader high period around late June, followed by lower weekly values.
Look at the axes before comparing point heights. The clicks axis now reaches **24**, and impressions reach **4.5K**. A taller weekly point doesn't establish traffic growth between these screenshots. You're looking at the same selected period, grouped differently.
Check the first and last points before drawing a trend through them. Google says [date ranges can cut off part of a week or month](https://support.google.com/webmasters/answer/17011259?hl=en). A short final period can look like a decline.
These charts show how the report changes visually; they don't establish what caused the traffic pattern.
## Choose the detail your question needs
For a regular traffic review, start with **Weekly**. If a particular week needs attention, return to **Daily** to see which dates contributed.
Use **Monthly** for a calendar-month report. Check how many months your date range contains: three months of daily detail become only a few monthly points. Keep Daily available when you need to locate a sudden change.
Google defines weeks as **Sunday through Saturday** and months as **calendar months**. These dates use **Pacific Time**, even if your browser uses another time zone. [Google's date-grouping documentation](https://support.google.com/webmasters/answer/17011259?hl=en) explains those boundaries.
Before reporting a week-over-week or month-over-month change:
- Check that both periods contain their full set of days. A range starting midweek gives you an incomplete first week.
- Check whether the latest period includes preliminary data. It can still change; see [Search Console data delay](/learn-google-search-console/limits/data-delay).
## Check exports after changing granularity
If you download this report into a spreadsheet, check the file before reusing an existing formula or script. Google says [file names, tab names, column headers, and sort order can change](https://developers.google.com/search/blog/2025/12/weekly-monthly-views-search-console) with the selected granularity.
For questions about how much data a download contains, read the separate [Search Console export limits guide](/learn-google-search-console/limits/export-row-limits).
## Sitemap
See the full [sitemap](/sitemap.md) for all pages.